International Journal of Humanities in Technical Education, Volume 1 | Issue 2| JULY 2015, ISSN 2454-8537
Transferring Visuals to Written Text in Technical Communication
Dr. Charul Jain Department of English The Maharaja Sayajirao University of Baroda Vadodara 390002
Introduction
With the introduction of Communicative Language Teaching, Task based teaching and content based instruction; there has been a paradigmatic shift in the curriculum being offered to the students of professional courses. Most of these courses, offer areas of study that are central to the needs of the students like writing reports of various kinds, variety of letters, proposals, etc. Students learning English for Academic Purposes for technical communication focus on the texts which are useful and beneficial for them during their course of study in the academic institution primarily and secondarily, also useful in their occupational career in the long term.
There is a great need to rely on authentic materials, taken from real life situations to teach these professional course students. Text "which is normally used in students' specialist subject area: written by specialists for specialists" according to Jordan (1997: 113-114) in his article 'English for Academic Purposes: A guide and Resource for Teachers' is defined as authentic material. Texts which are directly taken from handbooks or manuals for engineers in companies, letters and reports which they write as part of their routine course of work in industries, and proposals that are submitted in response to Tender notices are thus, authentic materials. They are heavily loaded with technical vocabulary or jargons commonly used in the field of work and also have specialized or particularized construction of sentences and paragraphs which are unique to those fields of communication. A letter written for procuring some equipment from an industry, or a purchase order as it is technically called, would have a combination of vocabulary drawn from various sources.
Jordan further adds that the material that "is not written for teaching purposes" is the most suitable for use in such classrooms. It is necessary to identify texts which bring real life situation exposure in the classroom as motivate the students and engage their attention constructively.
One significant aspect which is an integral requirement of all these forms of communication is the use of audio visual aids. Technical communication has a heavy reliance on variety of AV aids like, graphs, charts, figures, tables etc. Students are required to transfer information given in visual form to verbal and vice-versa. Many a time, teachers presume prior knowledge of the students in understanding of these aids and pay less attention to developing ability to do the needful however, many students whose medium of instruction in schools has been a regional language, grapple with such elements as they do not possess the requisite technical vocabulary and also the ability to construct discourse in English as needed. This paper deals with highlighting the significance of authentic materials in professional course curriculum and goes on to present one such item, an audio-visual aid and how transfer of information from visual to verbal can be enhanced in the students which will essentially be , forming vital links between real and simulated.
Verbal Decoding
Following is a chart which has been taken from Indian contextual analysis of 'a daily load curve of a power station' would be very relevant for an Electrical engineer's work place. One of the most important aspects of this chart is the fact that it is an authentic material used in real life industrial experiments. This is a simulation of real life.
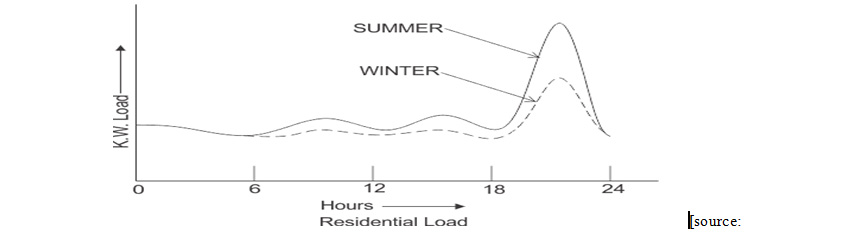
http://www.electrical4u.com/load-curve-load-duration-curve-daily-load-curve/]
Teaching Vocabulary
Some scaffolding has to be provided to the students to enable them to interpret the visuals, in this case, a graph. This would help them to understand and express their understanding of the image. Some vocabulary should be introduced to begin with that would help them understand the image.
Given below is a kind of lesson plan for teaching vocabulary and giving them exercises to ensure learning of lexical items associated with transferring visual information to a written text:
Look at the above figure and study the following words carefully:
The direction of the lines/curves that trace the load curve can be described using the flowing nouns and verbs:
| Curve | Noun | Verb |
|---|---|---|
| Up/upward | Increase | Climb |
| Rise | Go up | |
| Peak | Peak | |
| Fluctuate | ||
| Rise | ||
| Increase | ||
| Down/downward | Decrease | Decrease |
| Decline | Decline | |
| Fall | Fall | |
| Drop | Drop | |
| Go down | ||
| Level | No change | Not change |
| Level | Level | |
| Constant | Remains constant | |
| Stabilize |
Exercise 1: Now fill in the blanks inserting the correct nouns or verbs (the correct tense form) as appropriate in the following sentences:
1. The curve ___________ at 6.00 pm.
2. There is a/an __________ in the load at 6.00 pm.
3. The curve almost ___________ from midnight to early morning.
4. The load ___________ after 10 pm.
5. There is /an alternate _________ and _______ between 6 am to 6pm.
6. The load ____________ at around 21:30 hours.
To describe the rate of change, the following adjectives and adverbs can be used:
| Adjectives | Adverbs |
|---|---|
| Slight | Slightly |
| Gradual | Gradually |
| Steady | Steadily |
| Steep | Steeply |
| Sharp | Sharply |
| Sudden | Suddenly |
| Fast | Fast |
| Maximum | |
| Minimum | |
| High | |
| Low | |
| Equal | |
| More | |
| Less/Few |
Exercise 2: Now fill in the blanks inserting the correct adjective or adverb as appropriate in the following sentences:
1. The curve rises _________ around 18:30 hours.
2. There is a _____________ change in the load utilization from 6 to 9 hours in the morning.
3. The load rises ____________ from 18:00 hours till 20:00 hours.
4. There is a ___________ fall in the load after 20:00 hours.
5. Load utilization changes ___________ during the day but ___________ changes during late evening hours.
6. The ____________ load is around 6 am when people wake up.
7. _________ load is utilized during ________ than during the day.
Through such exercises vocabulary is introduced that is useful for understanding and expressing the ideas in the context as nouns (increase, drop), adjectives (gradual, steep), verbs (remain constant, climb), adverbs (fast, steadily). The exercises build up on linguistic competence; grammar and vocabulary use, and students are acquainted with sentence construction using vocabulary and comparative structure. They also get an idea how to alternate sentence construction using adverbs or adjectives for the same idea to bring in variety or to change the emphasis.
Teaching discourse using the graph
To extend their learning from here, students need to be taught how to write interconnecting sentences in a paragraph form. They need to understand how to sequence and order information presented in a logical way. Again a combination of some scaffolding and some exercises would help them learn to write what they interpret from the visual presented. A lesson plan follows:
Exercise 3: The following exercise describes the various parts of the curve but the sentences have been jumbled up. You have to put them in order in which they appear in the graph from left to right and form a paragraph:
a. During winters there is a similar curve with fewer variations.
b. A slow decline is seen in the load utilization after 10:30 till noontime.
c. There is less fluctuation in load utilization during winters than in summers.
d. There is a slight drop in the load towards early morning.
e. The peak load is less in winters than in summers.
f. The load increases slightly after 6 am.
g. There is a slight change, an alternate rise and fall between noon and 18:00 hours.
Exercise 4: Here is some additional information interpreting the graph. In the paragraph you wrote above, insert these sentences at appropriate places:
a. The load peaks at midnight when people go off to sleep.
b. The load drops when people leave for work.
c. There is a slight change in the load utilization while people are up and about during the day.
d. The load is more in summers as there is more utilization of fans and air-conditioners during night.
e. The curve represents the load utilization in residential area.
f. The minimum load is at about 3 am.
g. The bold line shows the load utilization in summers and the dotted line represents the load in winters.
Exercise 5: Write sentences describing the load during the following periods:
1. Till 6 am.
2. From 4:00 to 10:00
3. From 11:00 to 16:00 during summers
4. From 21:00 to 03:00 during summers
5. From 21:00 to 03:00 during winters
6. From 6 am to 6 pm in winters
Exercise 6: Now complete the following summarizing paragraph with the most appropriate words for the context relying upon what you have studied/ learnt so far:
The given ___________ describes daily load curve for _____________area. The ________ is on the x-axis and the time of the day (hours) is on the ___________. As it presents information about the ___________, there is a close connection between the residents' routine and ___________ in homes. The graph also provides a ___________ of the load utilized between during summers and winters. Since there is ___________ use of fans and air-conditioners during ___________, there is less power consumption.
Criteria for Selection of a Text
One of the most important criteria for selecting a particular text has to be whether it is in the realm of student experience and understanding. Ideally the text choice should be from a relevant field of study of the students' and should be easy to comprehend. Cluttering of information of high complexity of technical details is not the focus here. The prime objectives of this choice is not to teach content but to teach language used in analysis and description of a visual. The goal of this chapter is to equip the learners to interpret the graphs/charts and describe their analysis.
To enable the learners to do that, some objectives are set up like, learning and using the relevant vocabulary items, phrasal and grammatical structures, ordering and integrating the visuals with the text at appropriate places, etc.
The choice should be able to address the areas of communicative competence (Canale and Swain 1980, Hymes 1971) that are needed to be developed in students, essentially linguistic and discourse competence. Using the text students have to be taught vocabulary to be used while dealing with similar texts (linguistic) and also structuring the extended text, linkers to be used and sentence structure that is employed in such discussions (discourse).
There isn't much focus on Sociolinguistic competence as it is highly factual and descriptive. A lot of discourse competence is being focussed upon, on the other hand, in writing section of the text. A jumbled extract has to be put in correct sequence/ order, figures have to be inserted at appropriate places in the text, etc. Through such exercises discourse competence of the students is built integrating the building blocks of linguistic skills.
Another important aspect to be considered is sequencing. Ordering of the exercises is very logical as the building block, vocabulary, is introduced in the beginning. Simple exercises like, fill in the blanks, making short sentences with cues given, etc. are given in the beginning of the text and they build up to more complex, open ended exercise of describing a graph. Here again rearranging jumbled sentences, adding extra information to the text and inserting graphs in the write up are progressively introduced as student moves forward. Hence the students are taken from words---phrases---sentence-paragraph.
Authenticity and variety too are important considerations for selecting a text. A text which is drawn from actual life situation inspires and motivates students more as they realise its usefulness in their lives. A wide variety of exciting exercises are given as, identification of the graphic display, fill in the blanks, describing in short sentences, rearranging the stages of the text, etc. This variety breaks monotony and ensures that learners learn almost all the aspects related with visual interpretations without monotony and repetition.
Exercises presented here can be expanded and varied further by using different kinds of visuals. Interpreting a pie-chart is different from line graph and also from bar graph. So, the exercises could be developed relevant to different kinds of graphs and charts.
Conclusion
Writing about visuals is central to a professional course and students need to be trained in interpreting and transferring the information given in visuals to verbal mode. Appropriate selection of text keeping in mind authenticity, level of learners, complexity of the text, its ability to be adapted for developing communicative competence and bringing in variety of exercises to this end would ensure that the set objectives are met.
References
Canale, M. and M. Swain. "Theoretical bases of communicative approaches tosecond language teaching and testing," Applied Linguistics, 1(1), pp.1-47. 1980. Print.
Glendinning, E. and N. Glendinning. 1977. Oxford English for Electrical and Mechanical Engineering. Oxford: Oxford University Press. Print.
http://www.electrical4u.com/load-curve-load-duration-curve-daily-load-curve
http://www.nclrc.org/guides/HED/
Hymes, D. "Competence and Performance in Linguistic Theory" in R. Huxley and E. Ingram, (Eds.) Language Acquisition: Models and Methods. Pp. 3-23. London: Academic Press. 1971. Print.
Jordan, R.R. 1997. English for Academic Purposes: A guide and resource for Teachers. Glasgow: Cambridge University Press.
Sanyal, Mukti, et.al (Eds.) 2006. English at the Workplace. Delhi: Macmillan India Ltd. Print.